
Runtime diagnose of CUBA applications
Doing diagnosis on running applications is oftentimes a very tedious thing. To make this experience as smooth as possible, lets look on how CUBA can help us here. After that we will take a look at extended features that we can use like an interactive groovy console.
Investigating on a running system is hard
When you try to resolve an issue in a running system, it can be hard sometimes to effectively get the information you need to understand the problem. First of all, you need to understand the not always so clear bug descriptions you might have got from your customers. Sometimes it is reproducible in your test system, other times it is not.
In these cases you have to somehow get further information from the running system. In case you run your software on your own, you have to get access to the corresponding log files or application to see the error in real life, or at least see the impact it has on the software. When doing boxed software the situation is even worse, because the barrier to get to the required information just is higher and the process is more tedious.
You might already live in this fancy microservices / cloud world where you have full control over your running software. In this case, you probably have automated environments in place that will raise the visibility of insights into the systems.
If not, you are in this weird place where trying to identify the actual problem feels like trying to hit a target with a bullet in a totally dark room. Probably the majority of software developers have been more or less in this situation from time to time.
If you can identify with this situation or with the one below in the gif, you might be interested in seeing another tool in the runtime-debuggers’ toolset:

What CUBA brings to the table
CUBA already brings a lot of built-in features with it that will make your experience as a debugger much easier. Let’s have a short look at those features.
Entity inspector
The first thing that comes to my mind is the entity inspector (Administration > Entity inspector). This is a screen where you can have CRUD screens for every entity in your system. These browse and edit screens are dynamically assembled based on your definition in the entity model.
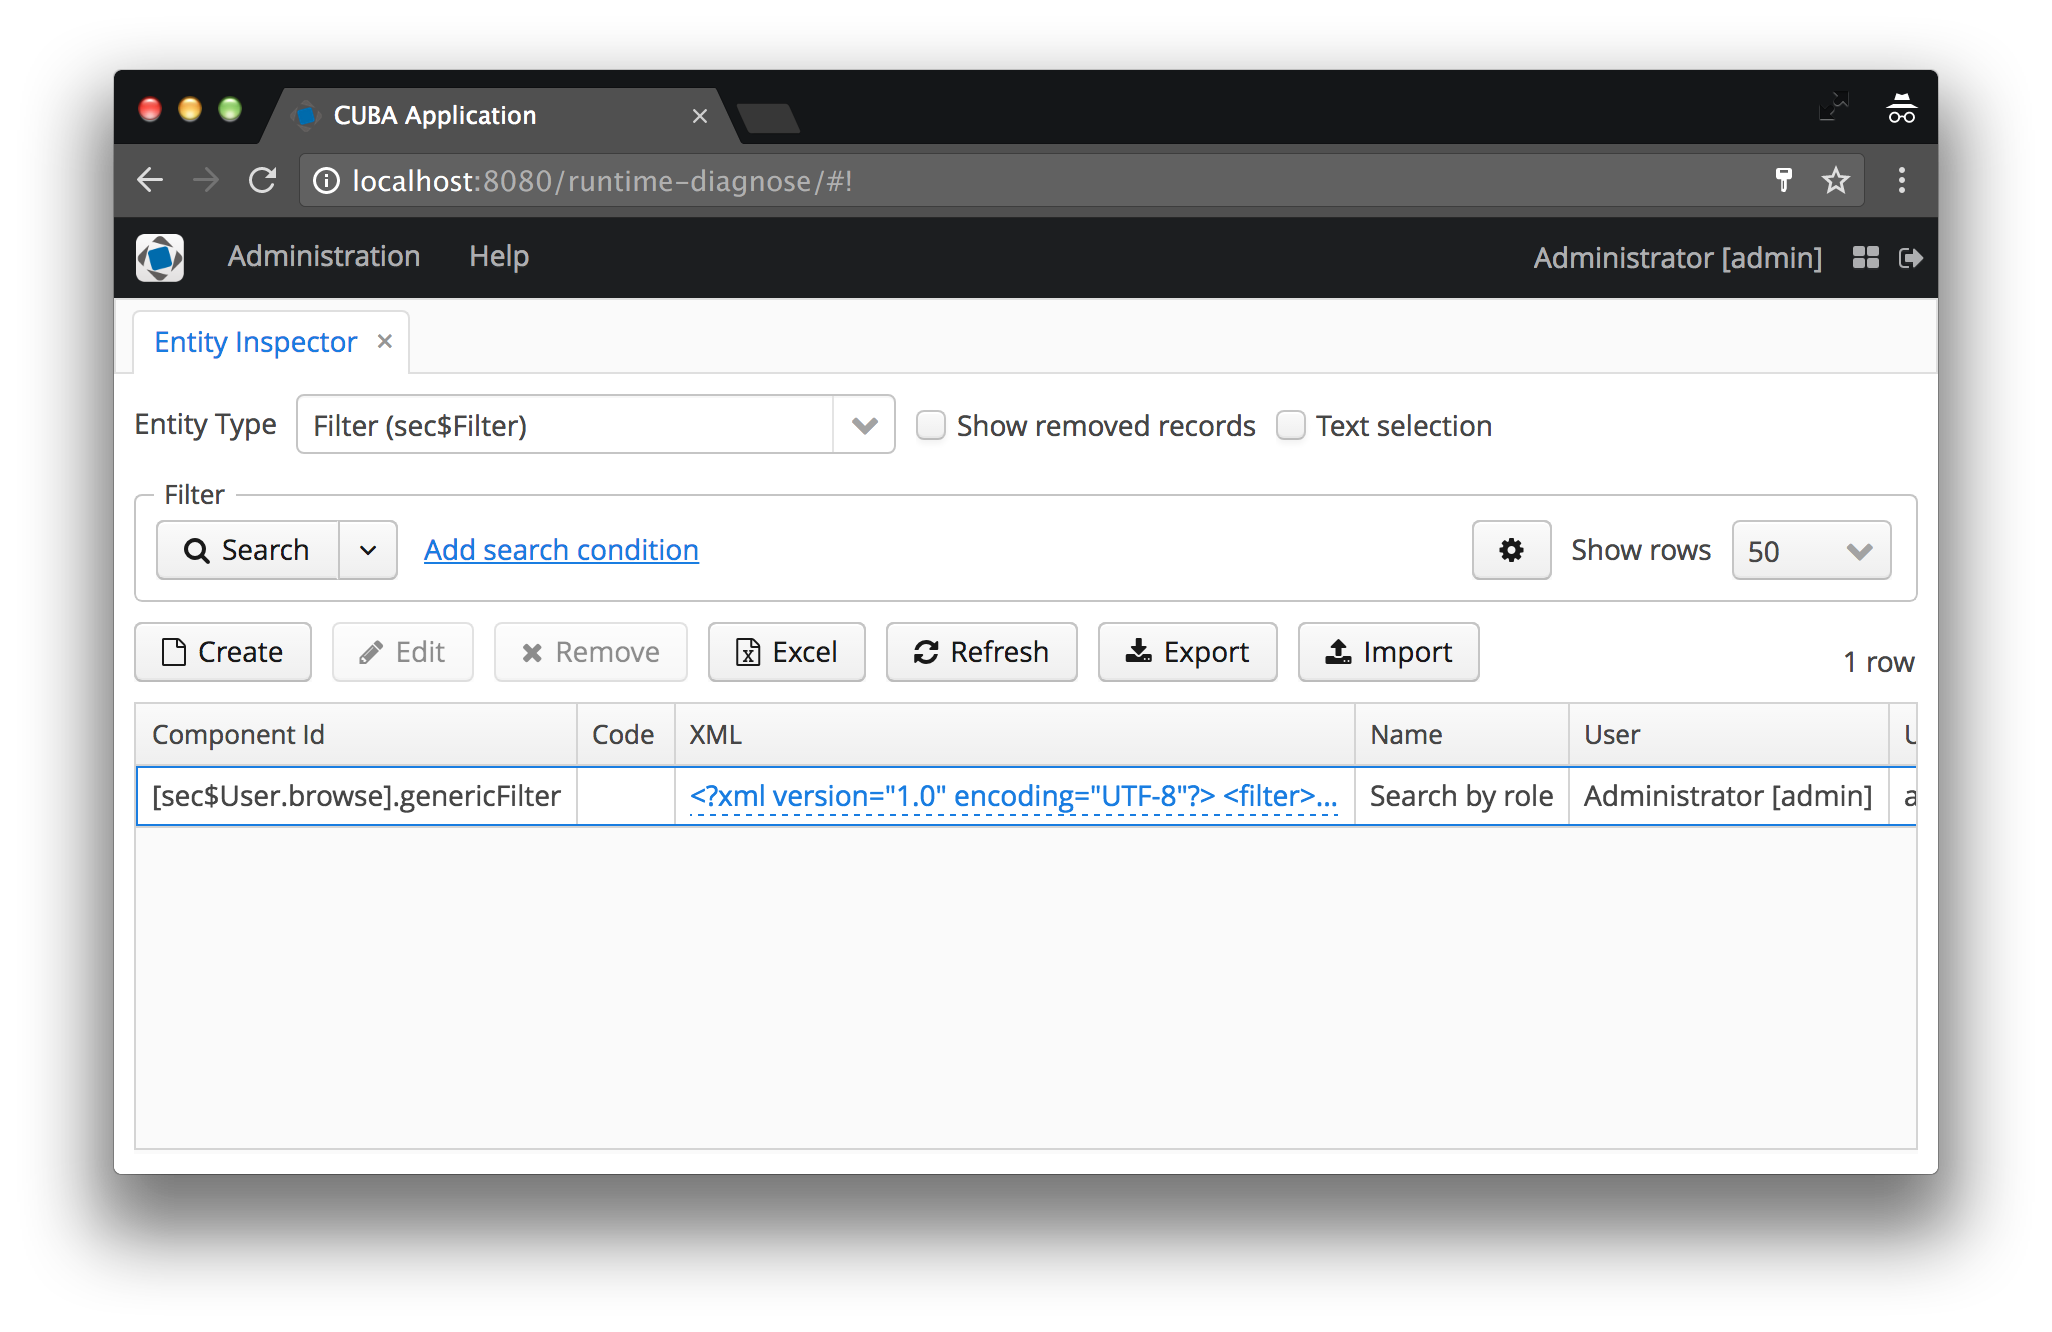
Lets say you have a Customer with orders and other attributes, the entity inspector will show you a list of customers. When you edit a customer, all direct attributes will be shown as a FieldGroup, Compositions and OneToMany or ManyToMany Associations will be displayed as tables, pretty much as how Studio will scaffold these screens.
It is a very good way to see exactly what entity instances are in your current system, so that you can get a better understanding of where the problem lies. This is especially true for entities that would otherwise have no user interface.
If you want to take a shortcut to fix a problem with the data, you can use the entity inspector to easily create and update entity instances, so that correct values are in place. Most of the time this is more of a temporary fix, nevertheless it is super valuable to have such a tool at hand if necessary.
sec$Filter entity that will puts you in the situation of getting to know how the filter mechanism internally stores the filter of the corresponding component.Inspect log files
The next very important thing is to have access to the server log files that have been created through logback. CUBA comes with a UI for accessing those files. You can get access to those Administration > Server Log
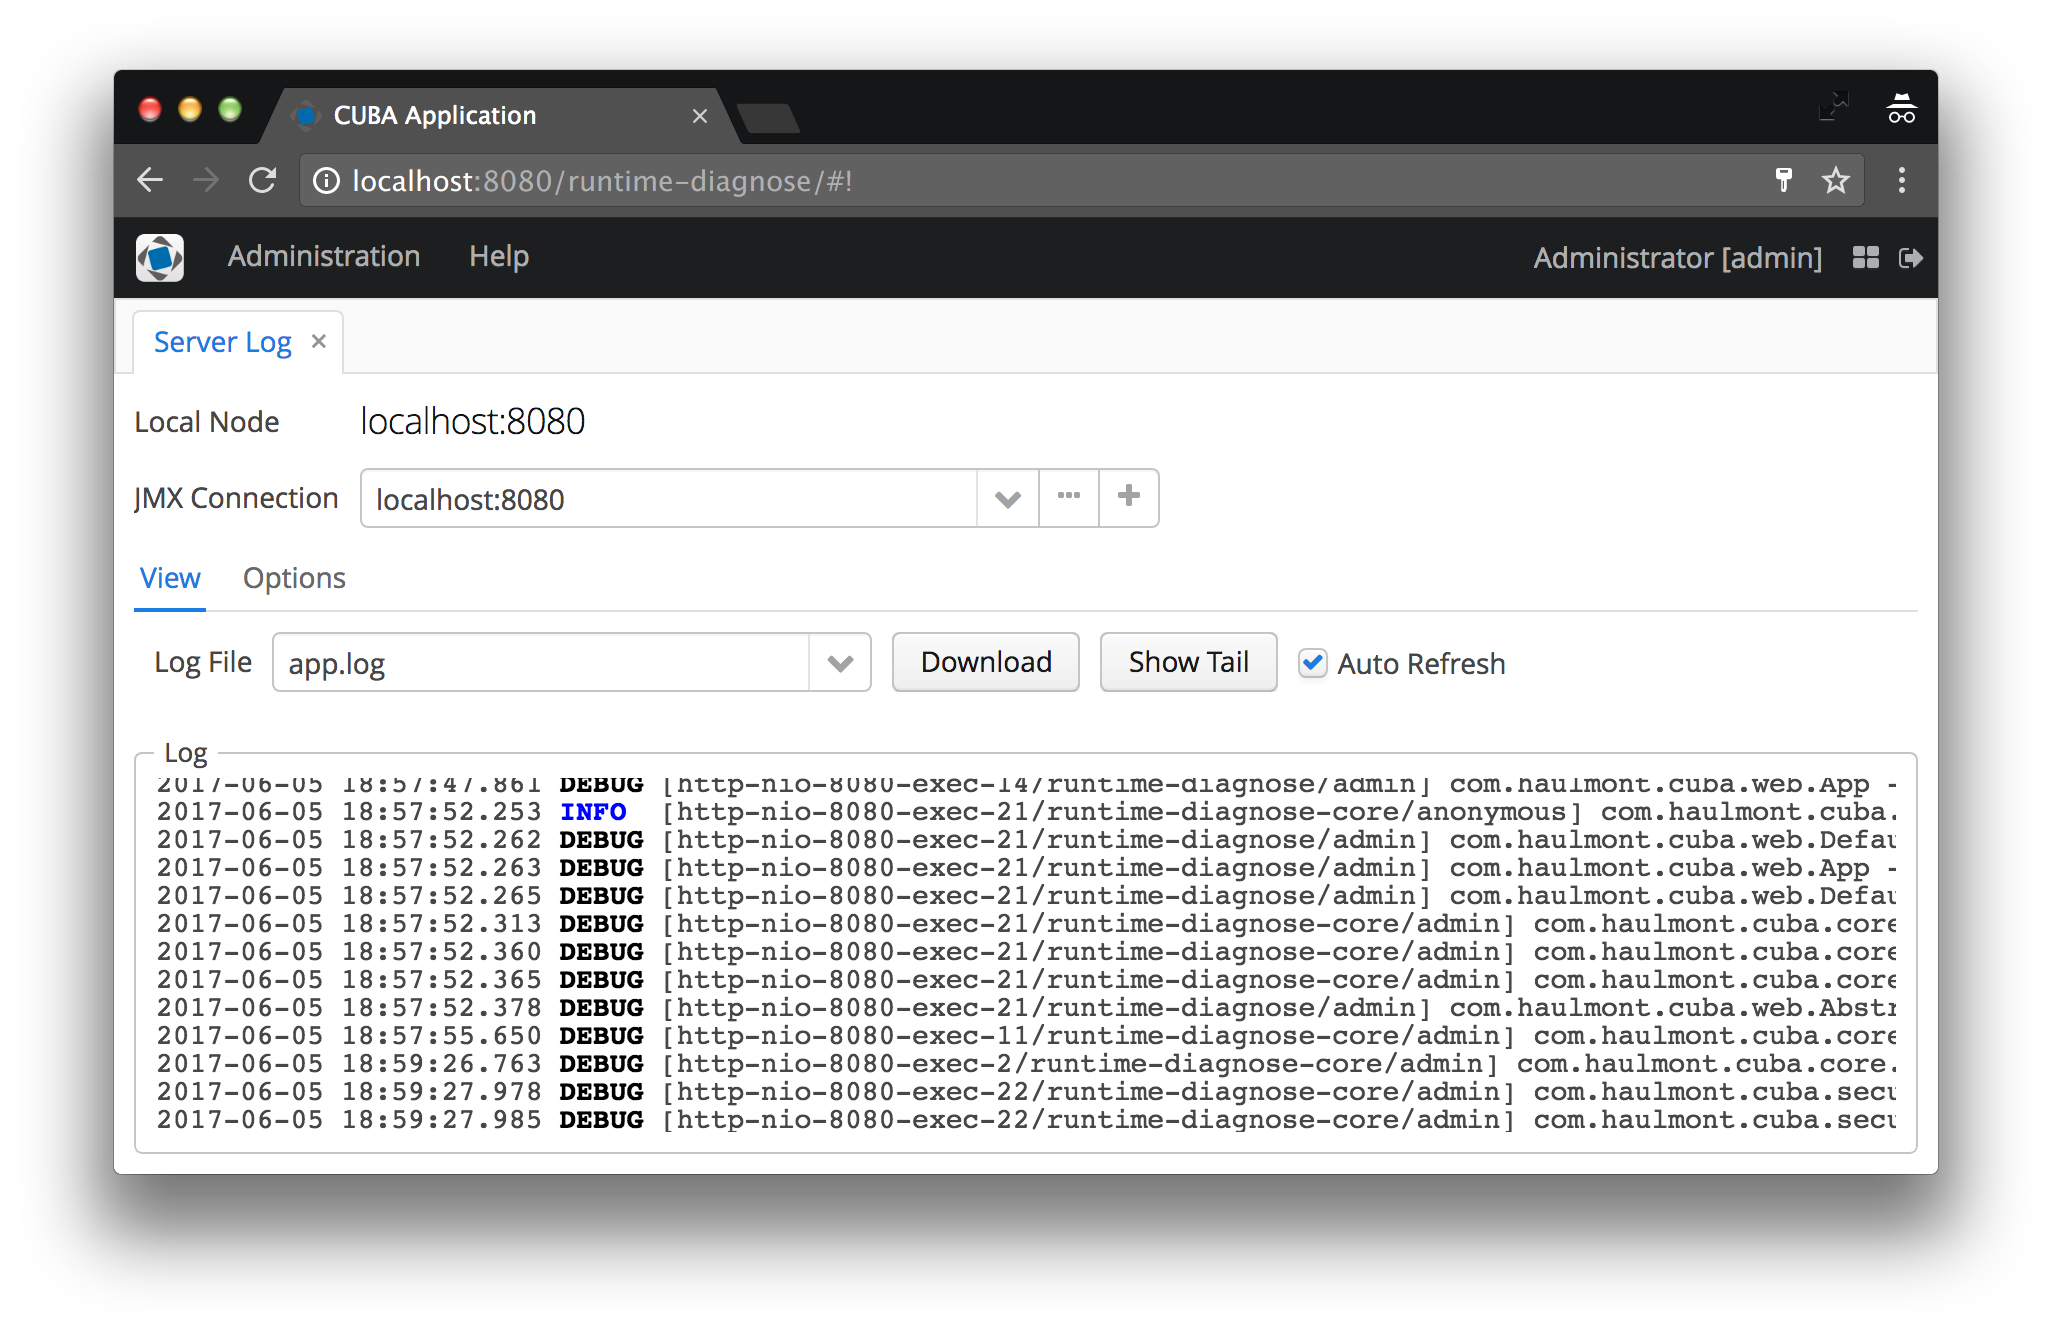
Besides seeing the content, you can also configure the settings of logging at runtime. If you need to have a higher logging level for one of your classes, or are not interested in certain platform logging information, you can just adjust the settings.
logback.xml) where the originated from. This means that after a restart of the application the settings will be back to the state of the logback.xml.
JMX console
The third feature of CUBA in regards of runtime debugging is a JMX console. JMX stands for Java management extensions and is a powerful tool to inspect running java applications as well as executing code in the application.
There are several tools in the Java ecosystem like JConsole that allow connecting to a remote java application (via a GUI or command line tools) and execute JMX calls. CUBA mainly enhances this feature through a UI that will display all managed beans that can be called as well as the methods on these beans.
Actually there are some other features of a CUBA application that will make your life as an application debugger easier, like performance statistics or screen profiler. I will not go through all of them, but you might want to scan through the administration menu to get an idea of what can be done.
Although with this we are in a pretty good position, there are some missing gaps. Lets take a look at what those are and what solutions can be used to have even more tools in your hands.
Advanced problem solving via runtime diagnose
When I was working in grails land, there was (and still is) a really cool plugin called the Grails console. What that basically is: it is just like an interactive REPL for a running application. It has a web UI, so it is possible to write code in this UI and execute it on the fly. This can be used for totally different purposes:
- manually adjust the Log4j settings
- insert data into the running system
- executing business logic you wrote in services e.g.
- shutdown the tomcat server
While some of these features are pretty cool, others are really scary (from a security point of view). So this plugin has to be used with caution and properly secured. Or like Spider-Man likes to phrase it:
With Great Power Comes Great Responsibility
The grails console for CUBA
I recently created an application component that took the ideas from the grails console and transferred it to CUBA island.
You can find it up on github: cuba-component-runtime-diagnose.
Actually this was just the starting point, because I took the chance to look a little bit deeper in the topic of runtime diagnose and came up with three different areas of features that are useful for doing analysis on problems in a running system.
1. Groovy console for ad-hoc debugging & diagnosis

The groovy console allows you to interactively inspect the running application. You enter a groovy script and execute it in an ad-hoc fashion. This obvisouly requires access to the running system.
The code gets executed in the core module of the application. Therefore all CUBA beans are at your fingertips. Here are some examples of what you can do with it:
- insert / update data through CUBAs DataManager
- execute middleware beans to get dianose information or trigger certain business logic
- correct data that have been introduced through a bug in your application
- check configurations
- …
Execution results
There are different results of a groovy script (displayed in the different tabs). The actual result of the script (meaning the return value of the last statement) is displayed in the first tab. The stacktrace tab displays the stacktrace of a possible exception that occurs during script execution. The tab executed script shows the actual executed script. For more information take a look at the docs.
These results can be downloaded as a zip file that will represent the tabs with the corresponding information.
2. SQL console for ad-hoc debugging & diagnosis

The SQL console allows you to interactively interact with the database using raw SQL statements. You enter an SQL script and execute it in an ad-hoc fashion.
Results of a SQL statement are displayed in a table in the result tab. The result can be downloaded using the Excel button in the Results tab.
The execution of SQL statements can be restricted. By default, only SELECT statements are allowed. For more information see the corresponding docs.
3. Diagnose wizard for non-interactive use cases

The last part is the diagnose wizard. This option is relevant if you as a developer or customer support person don’t have direct access to the running application, because of security reasons or it is boxed software that is running out of your control. You could send your counterpart on customer side a text file which the the user should execute in the Groovy / SQL console, but this process is fairly insecure as well as error prone.
In these cases you can send the person a zip file (as a black box) and tell them to upload this file in the diagnose wizard. The person will be guided through the different steps, executed the scripts and gets back the execution results (as a zip file) that should be handed back to you.
Tighten the bug-report feedback loop
Let’s look at the alternative we have in these scenarios. When the customer calls you that something strange happened in the application, you’ll ask them a handful of questions in order to get a rough idea what category of error this is, if it is a bug at all or more a misunderstanding of the application etc.
After that you might ask for the log files to take a closer look. Depending on how fast this information can be provided, you are waiting for some time. After you got the log files you really should pray to the debugging-god that you have good logging messages in places as well as properly configured logging. If you are lucky you see some null pointer exception with a stack-trace that you can start your investigation form. Other times you don’t see much. So you get back to your customer, ask them to adjust the logging settings and try to reproduce the error. After another round trip you might have more luck. Every step involves some email or phone calls with a lot of context switching on both sides.
I think I don’t have to describe the process any further. The bottom line is, this is a situation that occurs sometimes, but nobody really wants to be in this error prone and tedious situation.
To tighten this feedback loop a little you can use the workflow by the diagnose wizard since it gives you more direct feedback. The best situation in this regard would be the ad hoc groovy / sql console, because the developer feedback is immediate. But as this is not always possible so the Diagnose wizard allows you to find a middle course in this scenario.
Summary
With the built-in CUBA features as well as the runtime-diagnose application component you are able to get pretty good insights into your running applications.
It has been my first official open source project, and although it it is not a brand new idea, it has been a great experience working on it. I hope it will give developers of CUBA applications another tool in your debugging toolset.
If you have any questions and or improvement ideas, I would really like you to raise an issue on github, write me a mail or add comment below.